
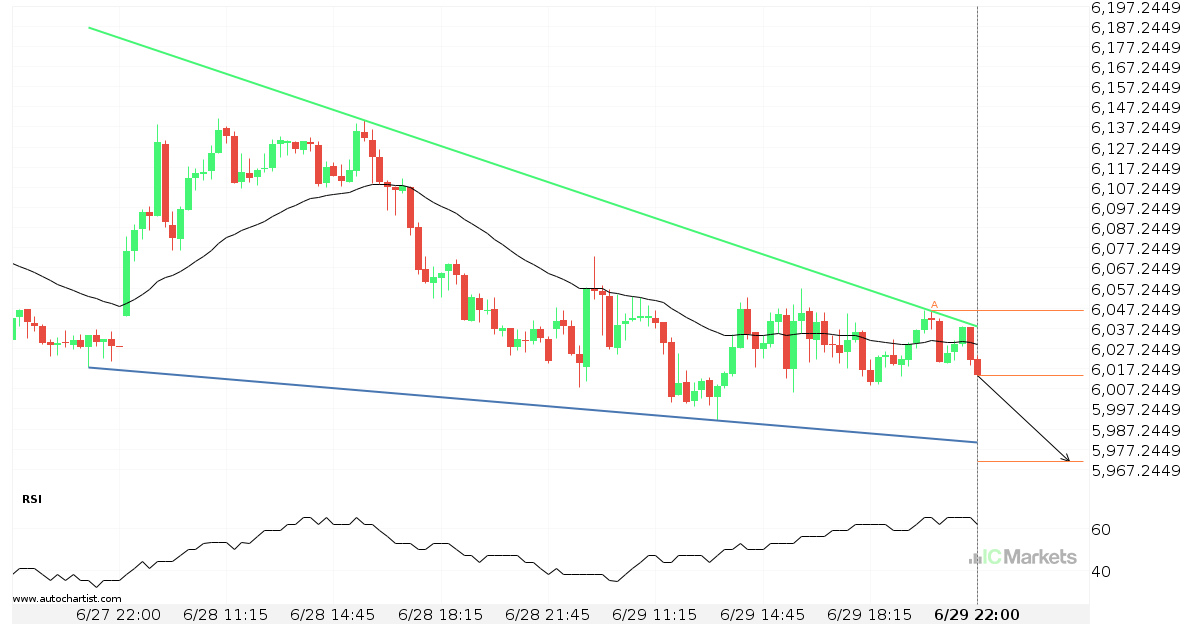
Inminente recuperación o irrupción del France 40 Index
El France 40 Index se dirige a la línea de soporte de un Cuña descendente. Si este movimiento se mantiene, el precio de France 40 Index podría probar el nivel de 5971.2154 en las próximas 9 horas. Ya ha probado esta línea en numerosas ocasiones, por lo que este movimiento podría durar poco y terminar […]

O bien, una inminente recuperación o una ruptura del EU Stocks 50 Index
El EU Stocks 50 Index avanza hacia la línea de 3544.3000. Si este movimiento se mantiene, el precio del EU Stocks 50 Index podría probar el nivel de 3544.3000 en un plazo de 11 horas. Pero no se apresure a la hora de operar, porque el par ha probado esta línea en numerosas ocasiones durante […]
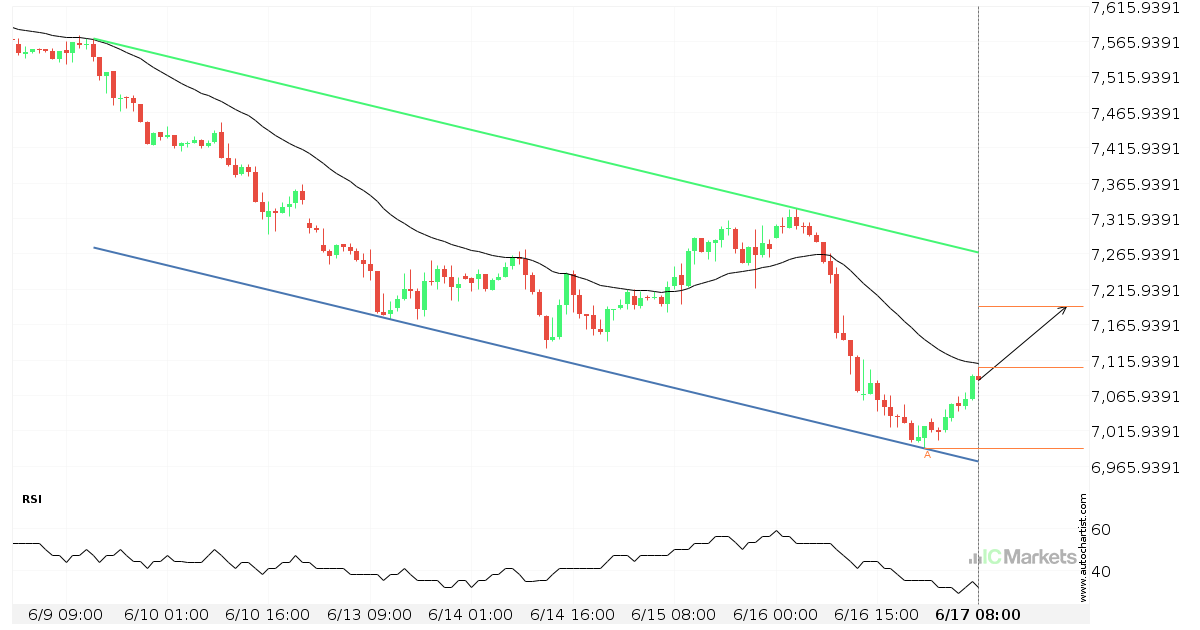
Posible ruptura del nivel de resistencia en el UK 100 Index
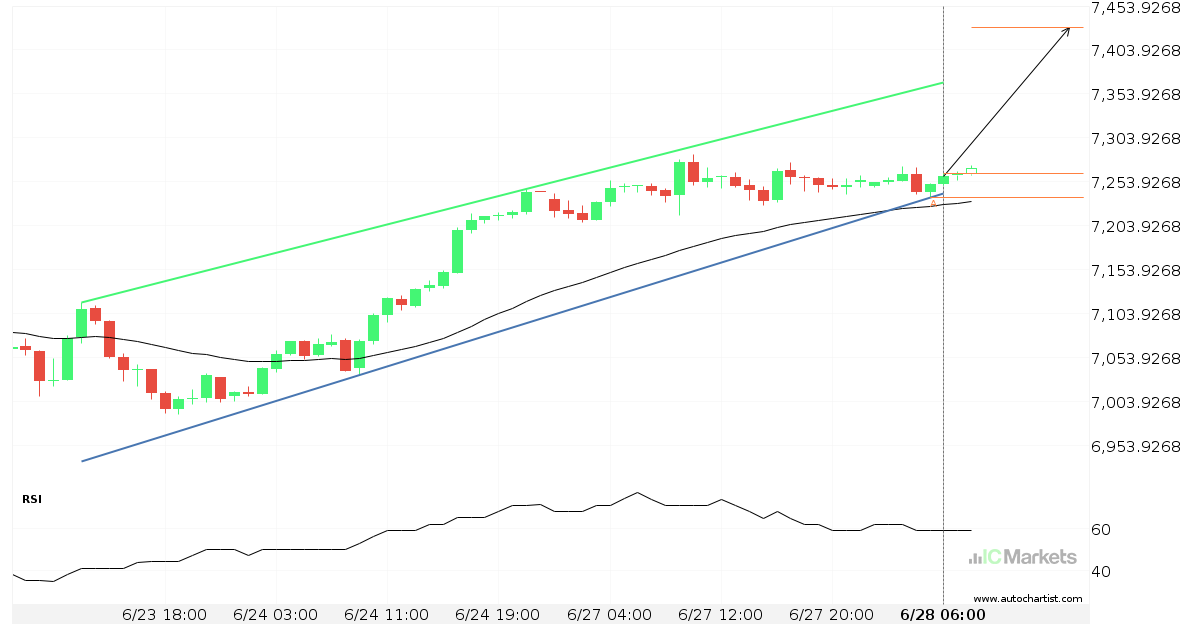
El UK 100 Index avanza hacia la línea de resistencia de un Canal alcista, que ya ha probado varias veces en el pasado. Hemos visto un retroceso antes desde esta línea, así que en esta etapa no está claro si atravesará esta línea o se recuperará como lo ha hecho anteriormente. Si el UK 100 […]
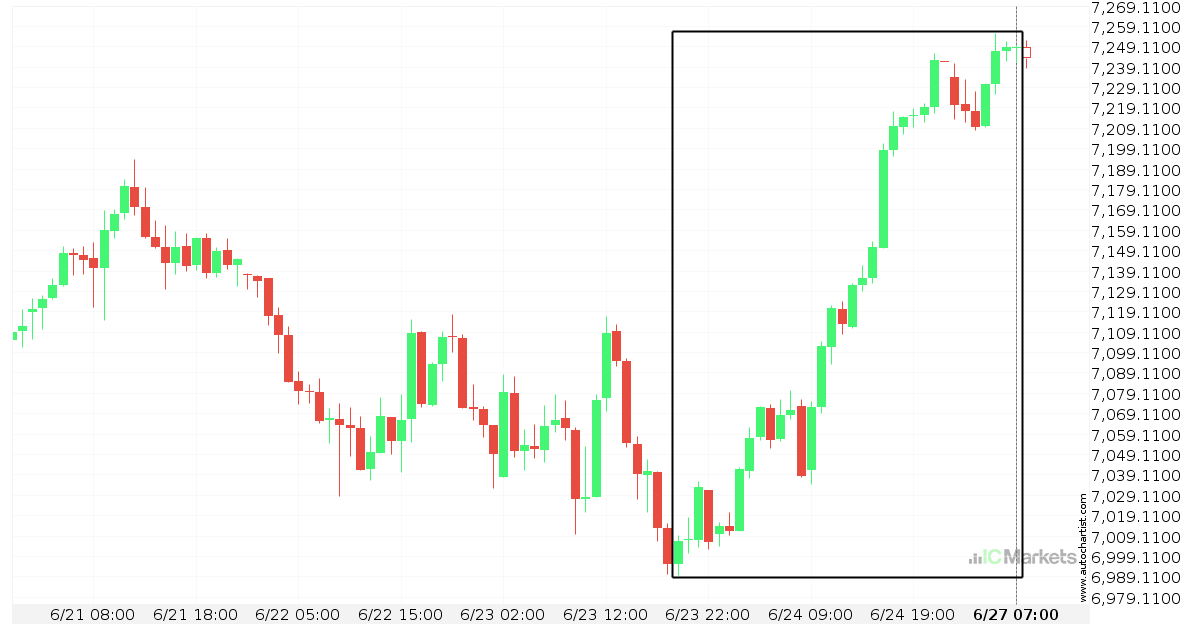
El UK 100 Index está en dirección up
El UK 100 Index ha experimentado un excepcional movimiento ascendente de un 3,46% de 6.995,1 a 7.249 en 4 días.
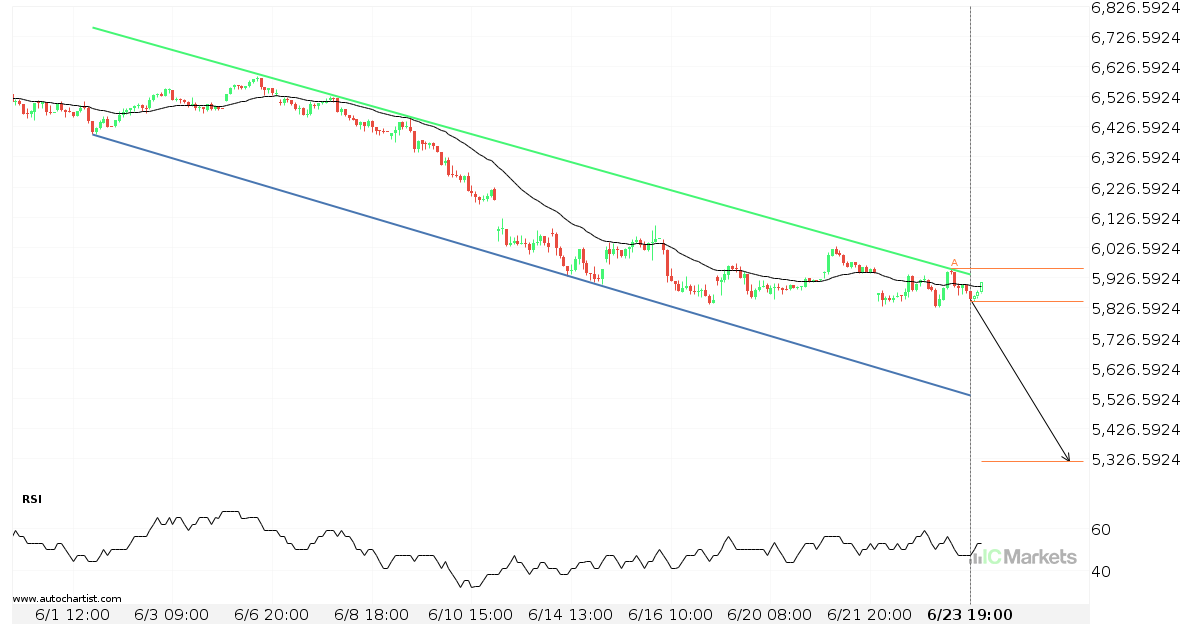
Inminente recuperación o irrupción del France 40 Index
El France 40 Index se dirige a la línea de soporte de un Canal bajista. Si este movimiento se mantiene, el precio de France 40 Index podría probar el nivel de 5318.5766 en las próximas 4 días. Ya ha probado esta línea en numerosas ocasiones, por lo que este movimiento podría durar poco y terminar […]
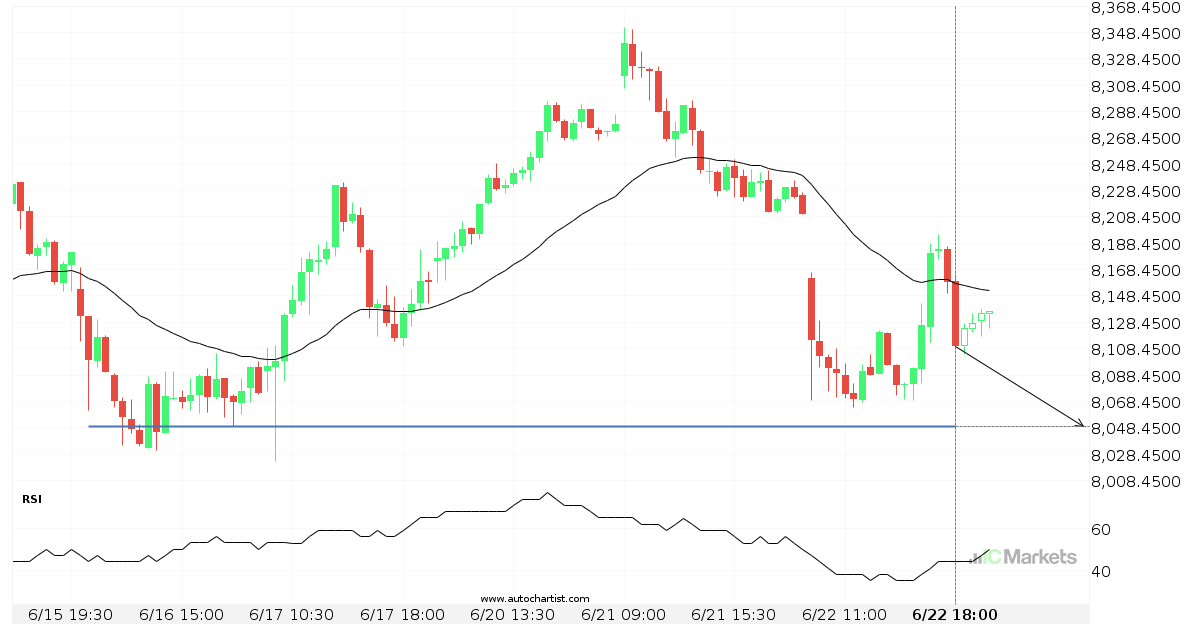
¿Deberíamos esperar una irrupción o una recuperación del Spain 35 Index?
El movimiento del Spain 35 Index hacia la línea de precio 8049.5000 es otra prueba más de la línea que ha alcanzado en numerosas ocasiones durante el pasado. Podríamos esperar que esta prueba ocurra en las próximas 10 horas, pero no sabemos si dará como resultado una irrupción a través de esta línea o simplemente […]
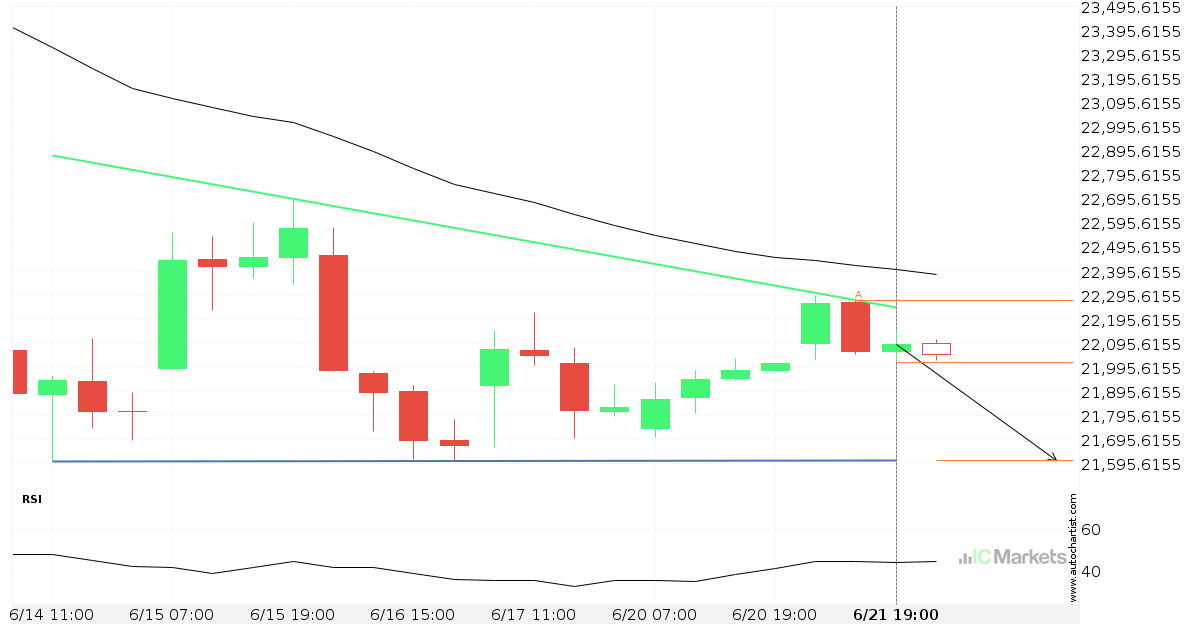
Posible ruptura del nivel de soporte en el Italy 40 Index
El Italy 40 Index avanza hacia la línea de soporte de un Triángulo descendiente, que ya ha probado varias veces en el pasado. Hemos visto un retroceso antes desde esta línea, así que en esta etapa no está claro si atravesará esta línea o se recuperará como lo ha hecho anteriormente. Si el Italy 40 […]
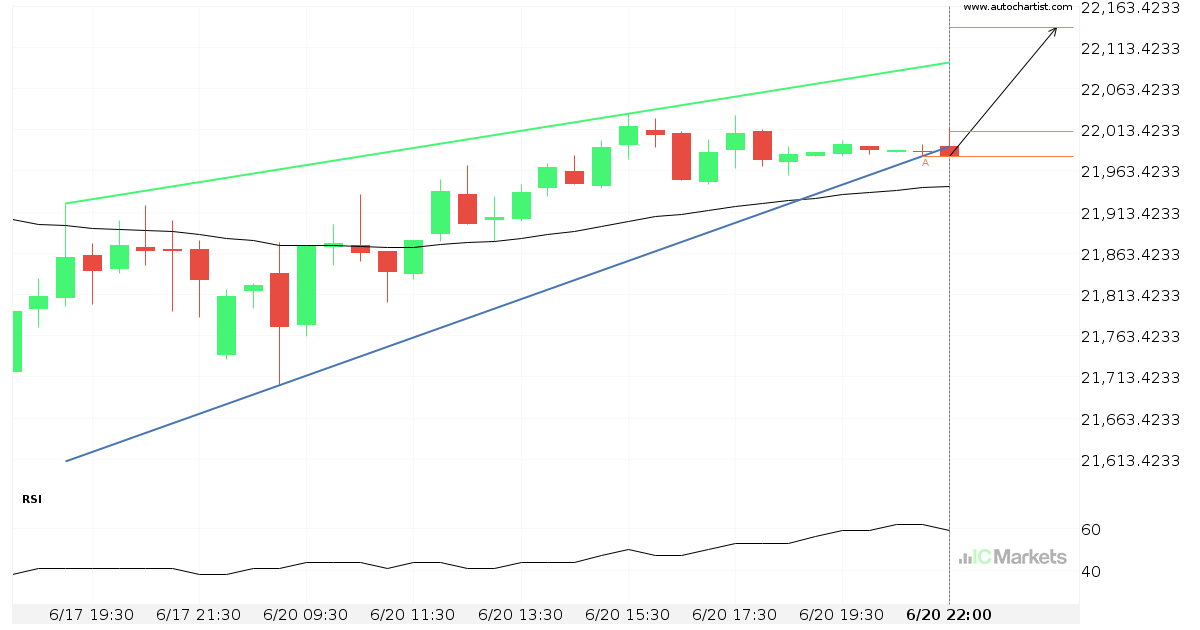
El Italy 40 Index se aproxima a la resistencia de un Cuña ascendente
El Italy 40 Index se está acercando a la línea de resistencia de un Cuña ascendente. Ha llegado a esta línea en numerosas ocasiones durante los últimos 4 días. Si vuelve a probarla de nuevo, debería hacerlo en las próximas 5 horas.
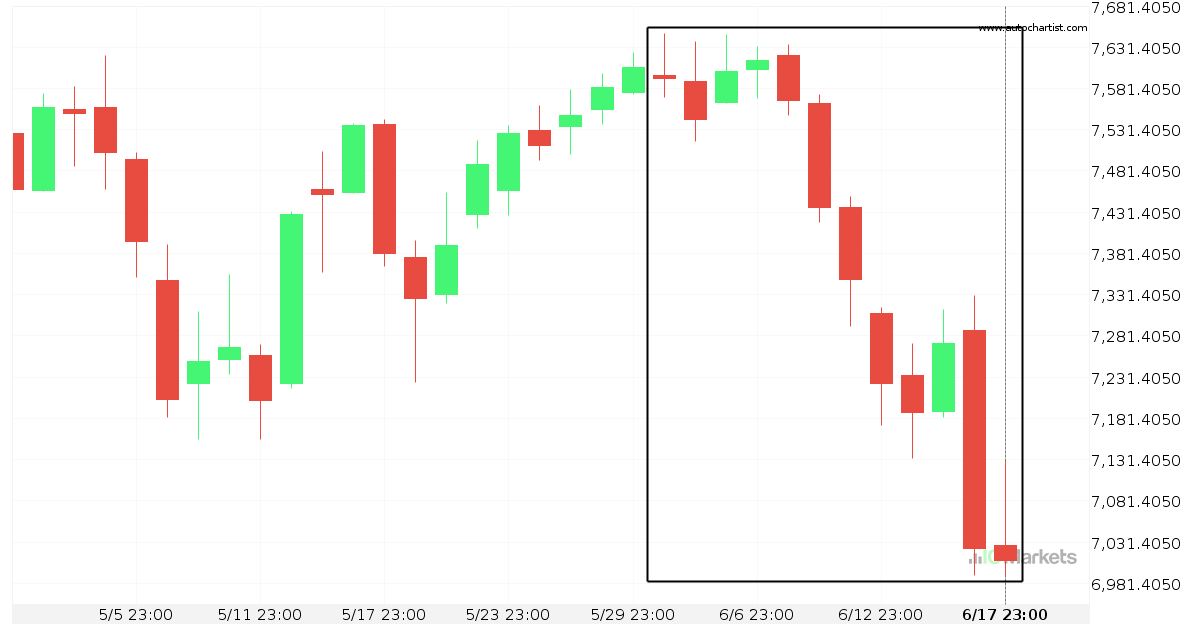
El UK 100 Index está en dirección down
El UK 100 Index ha experimentado un excepcional movimiento descendente de un 7,69% de 7.596,6 a 7.007,9 en 19 días.
UK 100 Index – acercándose a la resistencia del Canal bajista
El UK 100 Index avanza hacia una línea de resistencia. Como le hemos visto retroceder desde esta línea anteriormente, podríamos presenciar, o bien, una ruptura a través de esta línea o una recuperación a los niveles actuales. Ha llegado a esta línea en numerosas ocasiones en los últimos 8 días y puede probarla de nuevo […]